 News
News Wireless site surveys in disaster zones.
 May 23, 2014
 admin
admin
It was in December 2012 at the start of our deployment following hurricane Sandy that we carried out our first wireless signal survey. Our Sandy response effort in the Rockaway area of New York City was our first one in a 1st world environment and hence brought along some new and challenging aspects. One of these was the pre-disaster communications networks were much more ubiquitous than in previous theatres where we had deployed. Another was the much stronger response efforts with large telcos such as Verizon, AT&T, T-mobile and others despatching repair crews, COW‘s & COLT’s to affected areas as soon as the storm had passed. ISP’s also started repair work within days of the hurricane making landfall. A good video discussing the damage to telco networks and their response can be seen here. However the main challenge for the responding organisations is knowing where the communications service were down and more importantly where they were still working or had been restored.

In the first few days following hurricane Sandy, even before we deployed a team, Disaster Tech Lab had been busy mapping available public wifi services in New York City. Using an Open Source web mapping application called Crowdmap we first of all imported a dataset on all wifi hotspots in NYC. The dataset came courtesy of NYC Open Data. Unfortunately verifying all these locations to see which ones were still live was a huge task. Next we contacted Boingo one of the worlds largest wifi hotspots agreggators. We asked them if they could check which wifi hotspots on on their service, based in the NYC area were active. Boingo was very helpful and sent us reports every 6 hours of all hotspots which were passing data. Each of these locations was manually entered into the Crowdmap. This resulted to the map below:

However once we deployed a team on the ground it became obvious that apart from the information on what services were being available or restored was only available within the telcos. During coordination meetings with other emergency response agencies, from FEMA and the City of New York down to the grass roots efforts, it became clear that the telcos were not sharing this data. Not even amongst each other. Not only did this make work harder for all relief agencies, but it actually hampered the relief effort as some telcos were flooding the affected areas with COW’s resulting in cross network interference. I am not going into the reasons why this data was not being shared but at it was surprising that even FEMA did not have access to this sort of data. Real-time data on what services are available and where not only tells responders where they can go to communicate with the outside world, it also gives an indication of the extent of the damage and how quick the services are being restored. Extrapolating this data can for instance tell you where areas without any communication means are and that less or not mobile people there might not be able to contact someone for help. Responders would need to send teams into these areas to go door-to-door to check for people in need.
While there was a lot of high level discussion on what to do and what tools to use nobody was actually taking the initiative. The DTL team decided to just take the initiative. Using an Android tablet running Gmon (kept powered by a Goal Zero solar panel) we walked the lenght of the Rockaways surveying for WiFi networks. All measurements were geo-tagged and exported as a KML file. In addition we drove around with two iOS devices with 4G & LTE connectivity mapping the areas with coverage. The KML file was uploaded to Google Maps for and the areas with 4G & LTE coverage were added manually. It was a rough and ready approach but within the space of a single day we had a very good overview what wireless communication services were available and where.
One of the tools we looked at was the OpenSignal app. This app measures nor only the presence of mobile (2G/3G/4G) networks but uploads that data to their servers and created beautiful heatmaps. The main disadvantage is that the data isn’t processed in realtime. As we saw no point in re-inventing the wheel we approached the people behind this app and had discussions about how we would like to see an adapted version of this app that could be used in disaster zones. FEMA also had similar discussions with them and they agreed to start development of the app. Some field testing was done during summer 2013 by the FEMA Innovation team.
When typhoon Haiyan/Yolanda hit the Philippines in November last year a rudimentary version of the CrisisSignal app was ready but no web GUI had been developed yet so while data could be gathered there was no means to visualize the results. However the apps was pushed heavily by people within UN, the ETC and other tech response organisations. They advised all their personal to run the app and allow it to upload data automatically. We at Disaster Tech Lab also decided to advise our tech teams to install and run the app. In addition we contacted OpenSignal and gained access to the raw data so that we could use it internally. At the same time member organisations of the did excellent work Digital Humanitarian Network in partnership with Open Signal to mapping the data collected by *all* organisations using the app. They used the ArcGIS platform to map all the data.
I had great expectations of the result of so many people using this app and was looking forward to a wealth of data being mapped. However when I checked the map below this is what showed:
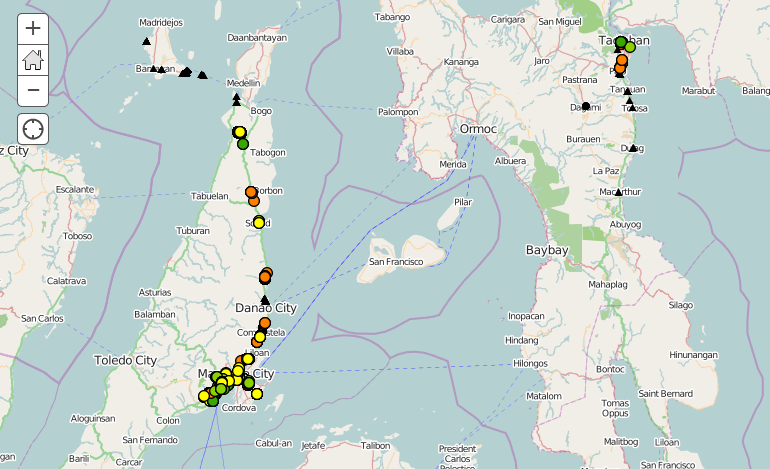
While it displays a good amount of datapoints almost 90% of the collected data has been gathered by our teams on the island of Cebu. Compare that with the very limited amount of data gathered around Tacloban which saw a very large deployment of humanitarian aid organisations in a relatively dense area. Logic would dictate that there would be many more datapoints in that area than on the island of Cebu. After all Disaster Tech Lab only deployed 18 people over a 4 month period compared to the might of the global humanitarian “industry” which deployed en-masse to the Tacloban area. We have gone from rudimentary tools with good outputs to sophisticated tools with minimal output. If the field of humanitarian aid is serious about using technology as an essential part of their response effort (and they should be serious) they need to start using the various tools in the field. Organising hackathons and field experiments is all good and well but if we don’t push for a widespread live testing and application of these tools then we won’t advance our efforts or improve our efficiency.